Cloud
Cloud is the cost, usage and capacity of cloud. It unlocks more insightful questions and produces more accurate outcomes by mapping relationships among high volumes of connected data
Prerequisites: A cloud account should be added in RLCatalyst settings.
How it is working:
- Aggregate and graphically represent statistical AWS resource cost data at different granuralities across time intervals to assist end user to easily analyse and optimize resource usage.
- Collect and graphically represent usage trends data of provisioned AWS resources across time intervals to assist end user in identifying resource utilizations patterns and optimize deployment strategies.
- Provide APIs to access usage and cost analytics data at different granuralities across time intervals to enable automation of usage analysis to gain insights and to develop prediction algorithms based on these insights to optimize resource utilization and reduce cost.
How to use:
Navigate to Cloud tab in the header. There is Menu at left handside and under the analytics we can see below options:
- Capacity
- Cost
- Usage
Cost
Cost is Cloud Cost on data.
Page has two tabs Dashboard and Reports.
- Dashboard: By default it will show Dashboard details in the form of graph. Dashboards let you monitor many data at once, so you can quickly check the health of your accounts or see correlations between different reports.
AWS cost analytics:
Collect hourly costs for all AWS resources for all added providers.
Aggregate hourly, daily, monthly and yearly costs for catalyst entities and provider specific entities based on resource allocation.
- Catalyst entities: organization, business unit, project, environment, provider type, provider, resource
- Provider specific entities: region, resource types (EC2, S3, RDS etc)
Provide API to query for aggregated data based on catalyst and provider specific entities across time periods. Start date for aggregation shall be decided based on specified period. End date shall be specified by the consumer of the API
- Periods: hour, month, day, year, 5 years, 10 years
Provide APIs to query for resource cost trend for specific catalyst and provider specific entities across time periods, for specified intervals. Intervals shall be limited based on the specified period, limited by the cap of number of data points in the response.
- Intervals: hourly, daily, weekly, monthly, yearly
Time series data will be stored with UTC timestamps
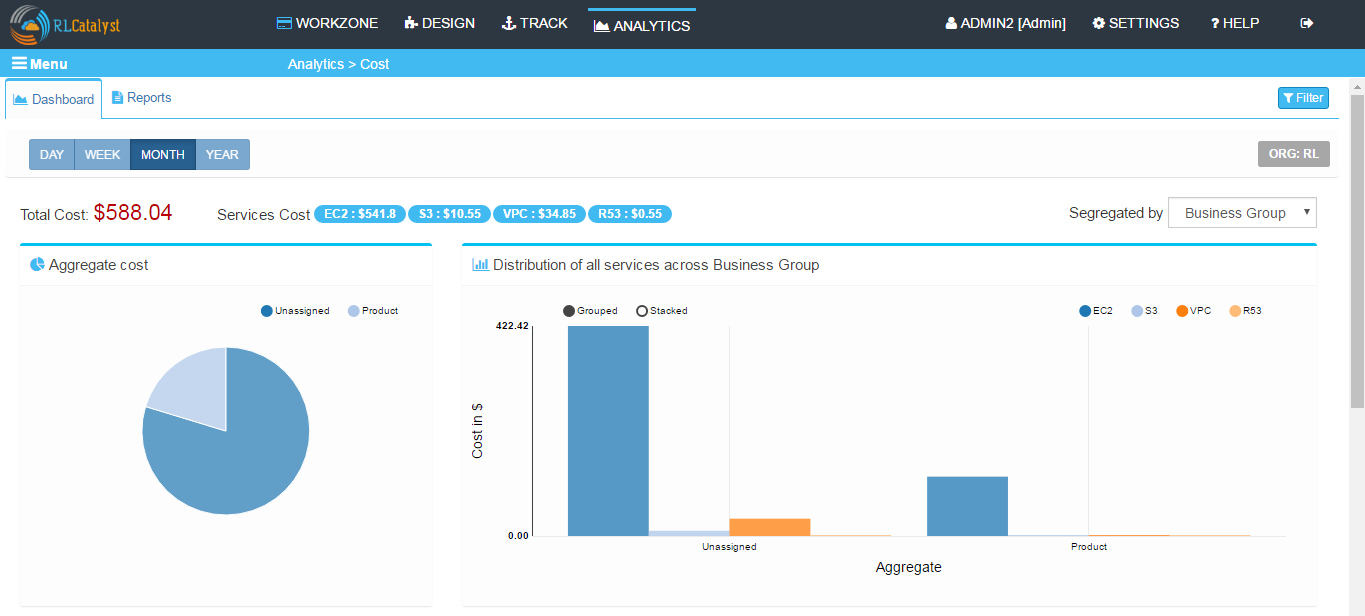
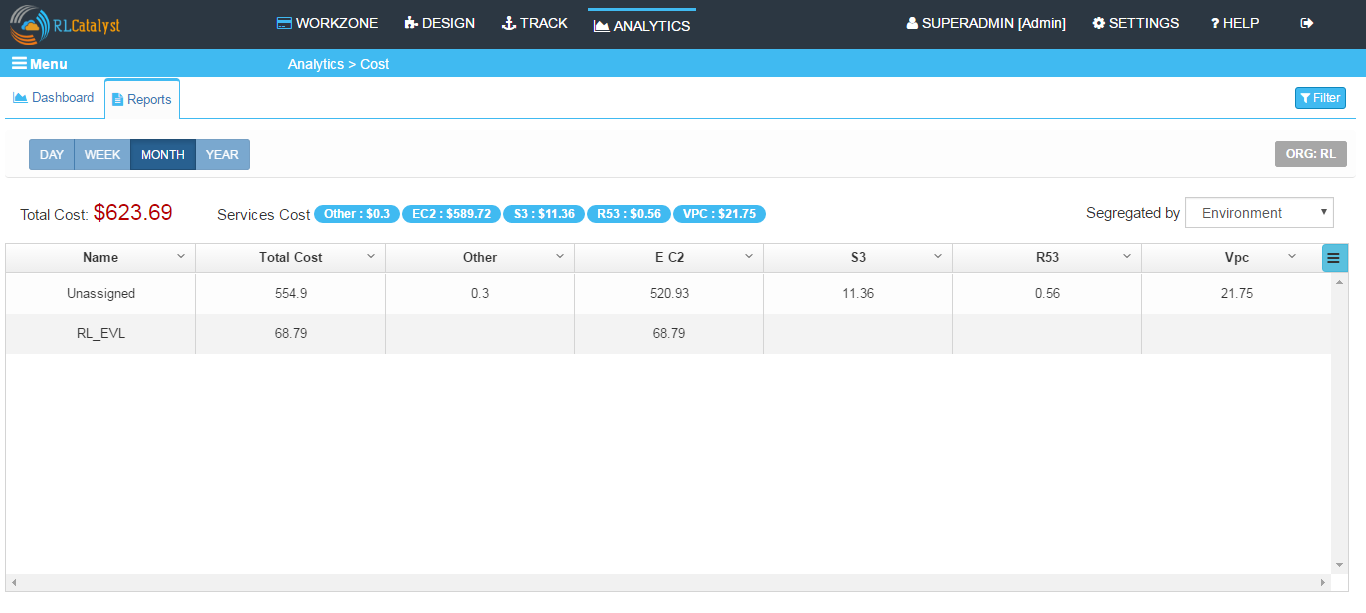
We have total cost, and aggregated cost for different services EC2, S3, R53, other etc for the month segregated by Business Group, Region, Environment and Provider. To show the graph we have to do the mapping in provider sync, mapping tag values with Business Group, Project and Environment respectively. Graphs are in three forms:
- Aggregate Cost: It is a Pie Chart, which display all aggregated total cost details.
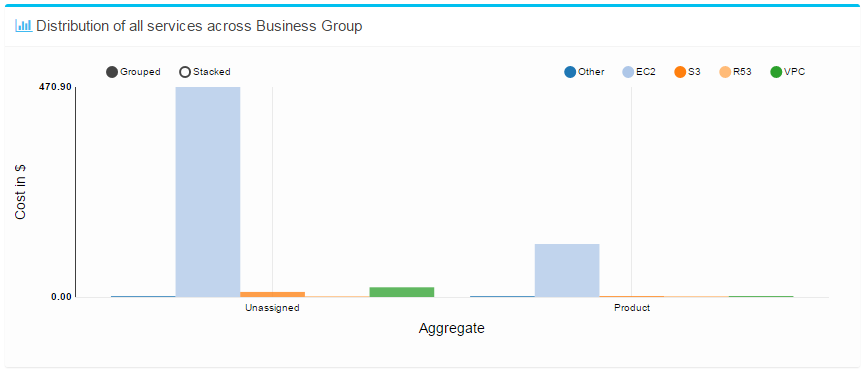
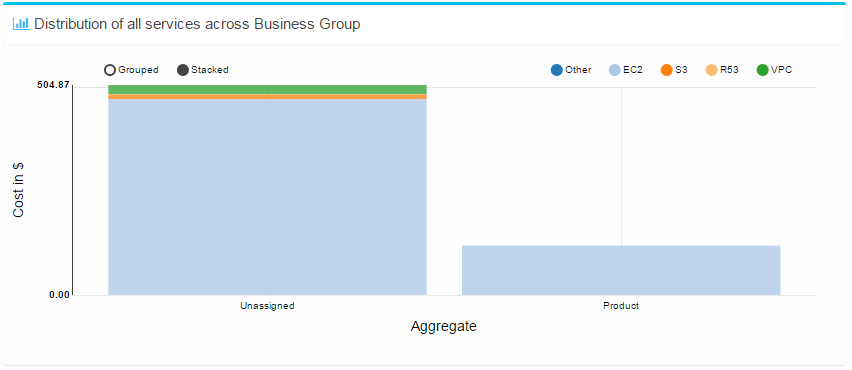
- Distribution of all services across Business Group: Here we have Bar chart, it is drill down of pie chart - grouped and stacked for services, in grouped the services would be available in single bar chart and in stacked the services would be in multiple bar charts.
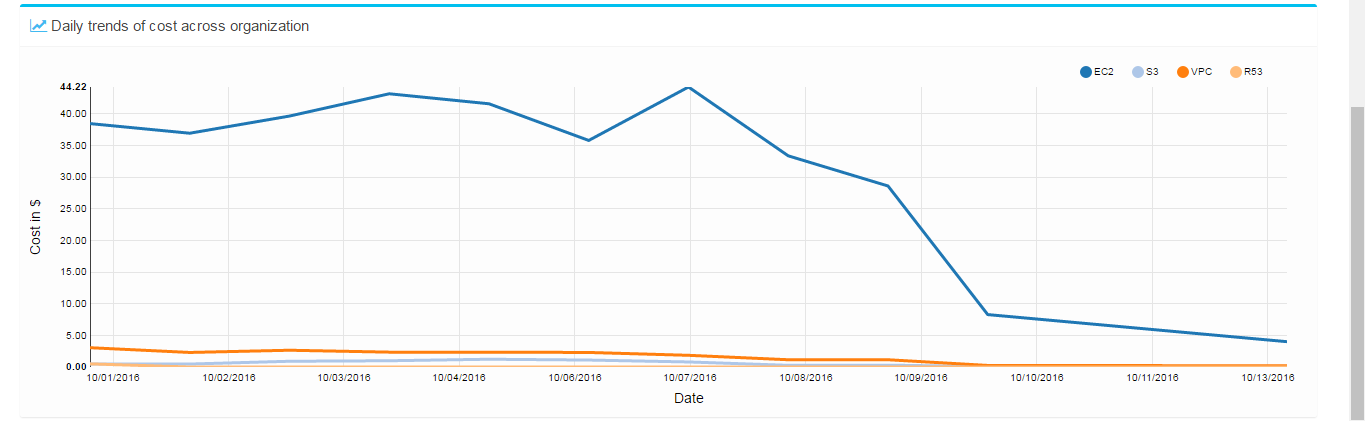
- Daily trends of cost across organization: It is a Line chart, the data would be on daily basis accross organization.
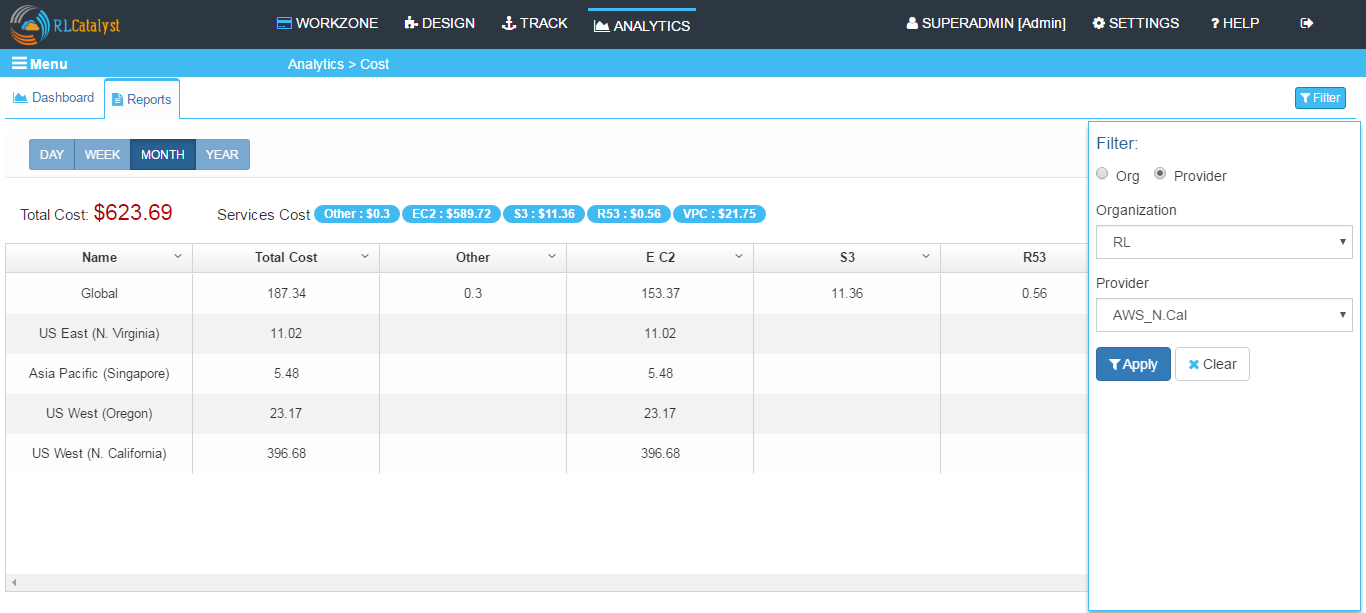
- Reports: In Reports tab the data will be in tabular form Name, Total Cost, Services.
We have few options available for the table, on the right side of the table

We can remove any colunm from the table by just clicking on the field name, let say remove “Total Cost”
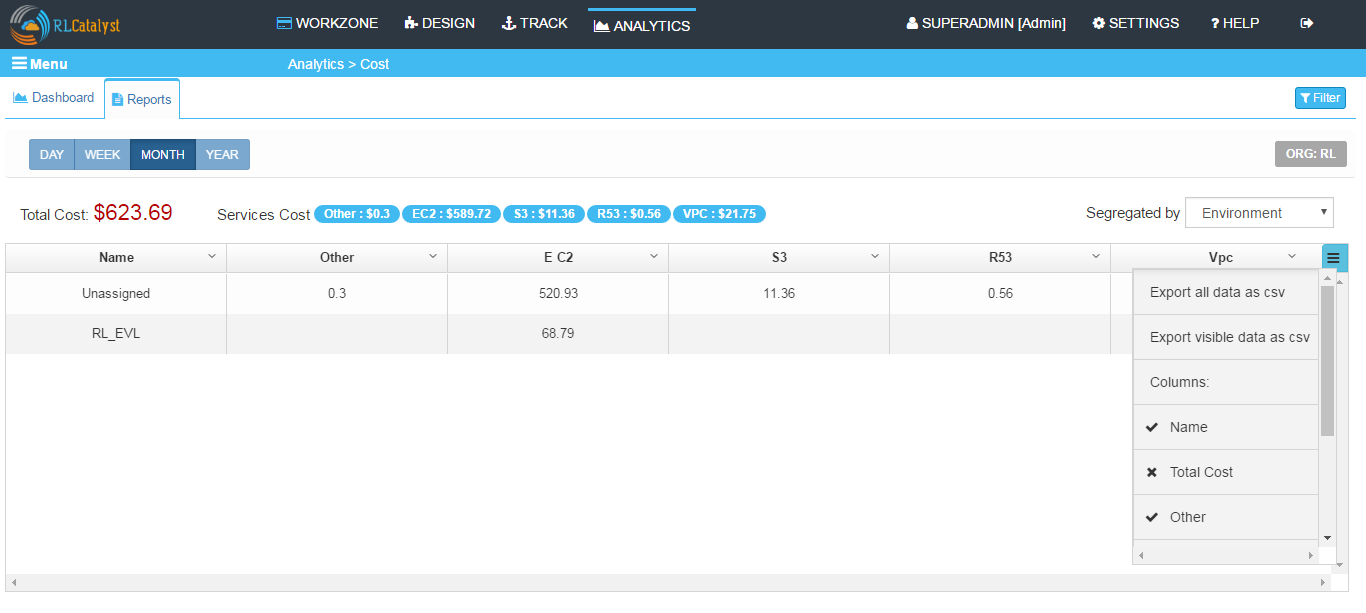
Now, “Total Cost” field is not available in the table.
We have two more options “Export all data as cvs”, it will export all data from the table in cvs format. And “Export visible data as cvs”, it will save only the visible data from the table, it will not save the removed data from the table.
- Filter: We can filter the data on the basis of Organization and Provider.
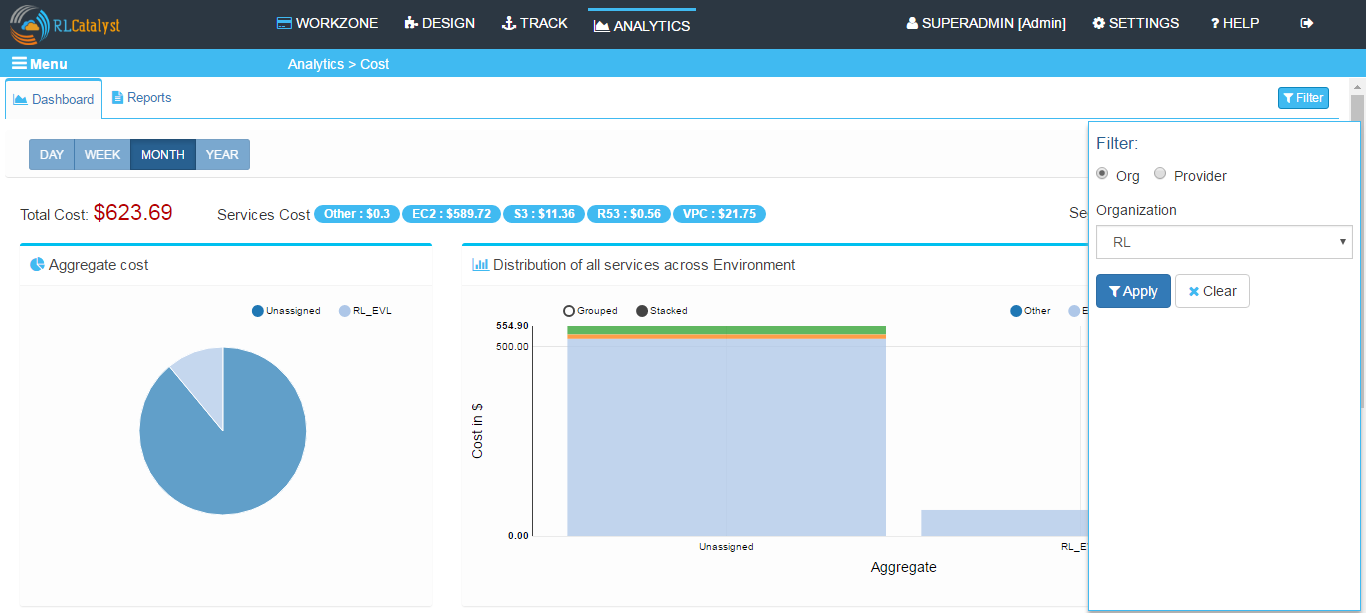
If we want to filter the data on the basis of provider, we can select any provider from the drop down
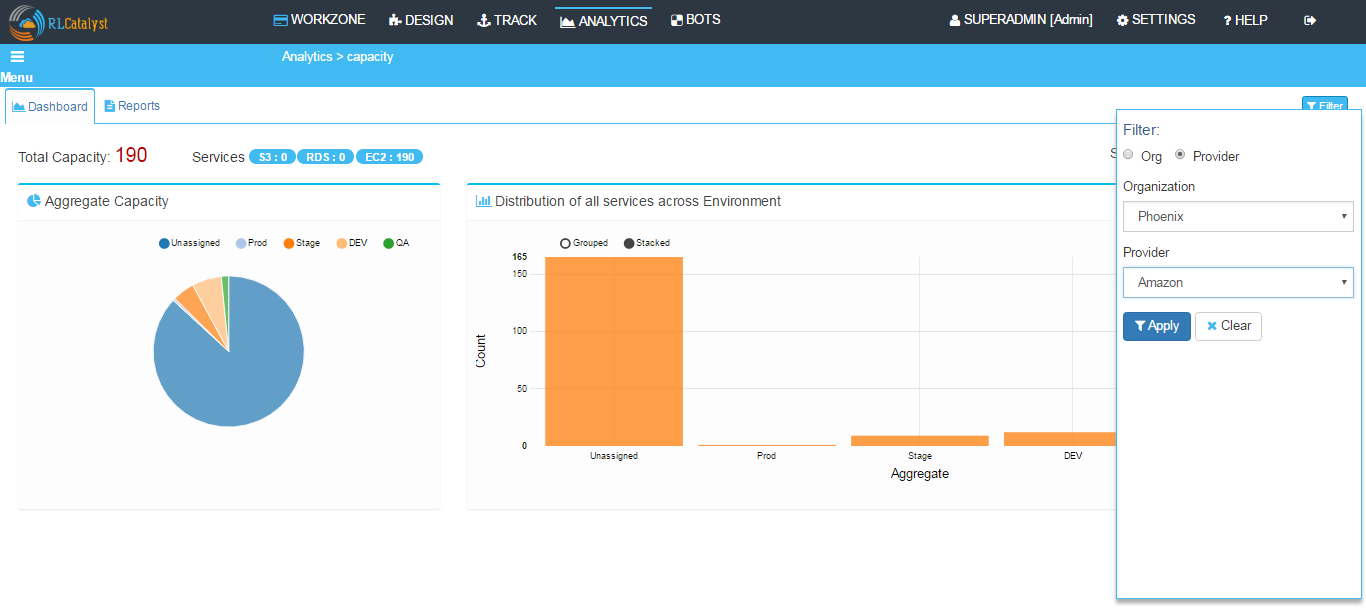
Capacity
Capacity is number of Instances
Page has two tabs Dashboard and Reports.
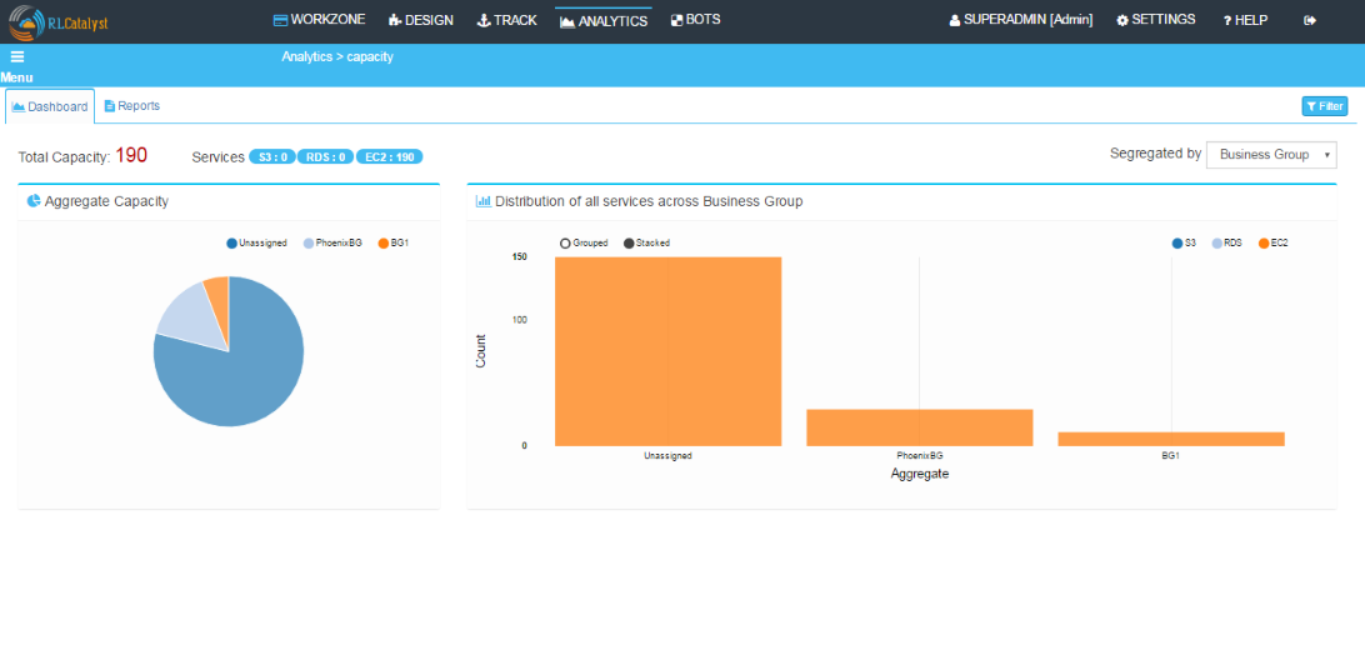
Dashboard: Dashboard shows you the capacity of the Instances.
- Total Capacity, it shows you the available number of instances
- Services, it shows the capacity for services like s3, RDS etc.
- Segregated by, the capacity would be Segregated by Business Group, Provider, Environment and Region
We have two graphs
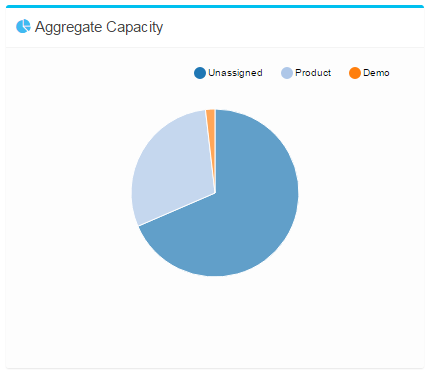
Aggregate Capacity: It is a Pie Chart, which display all aggregated total capacity details.
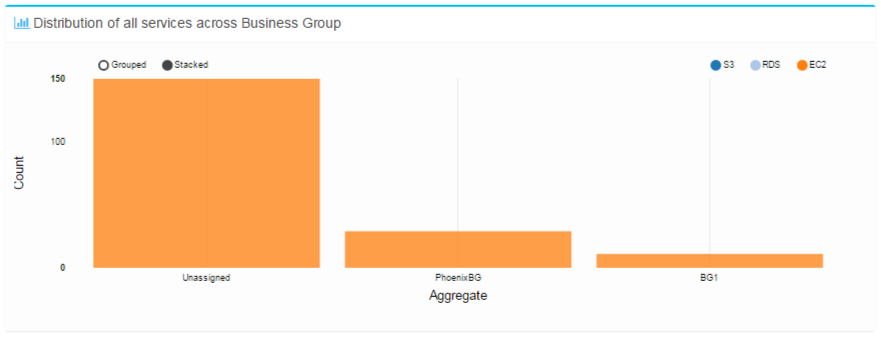
Distribution of all services across Business Group: Here we have Bar chart, it is drill down of pie chart

Reports: In Reports tab the data will be in tabular form Name, Total Capacity, Services.
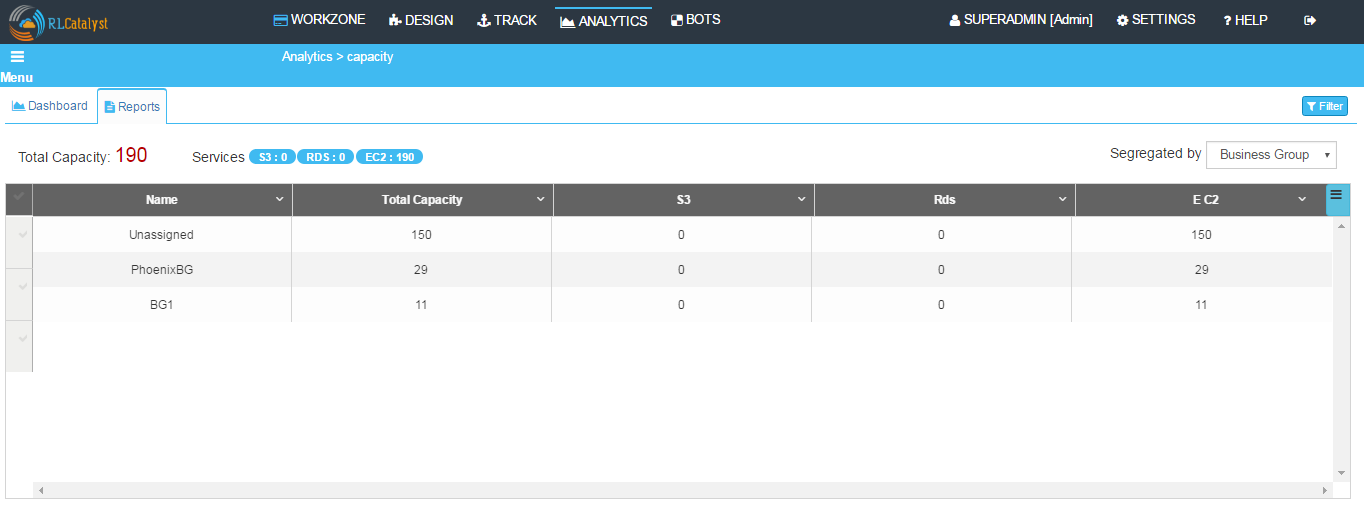
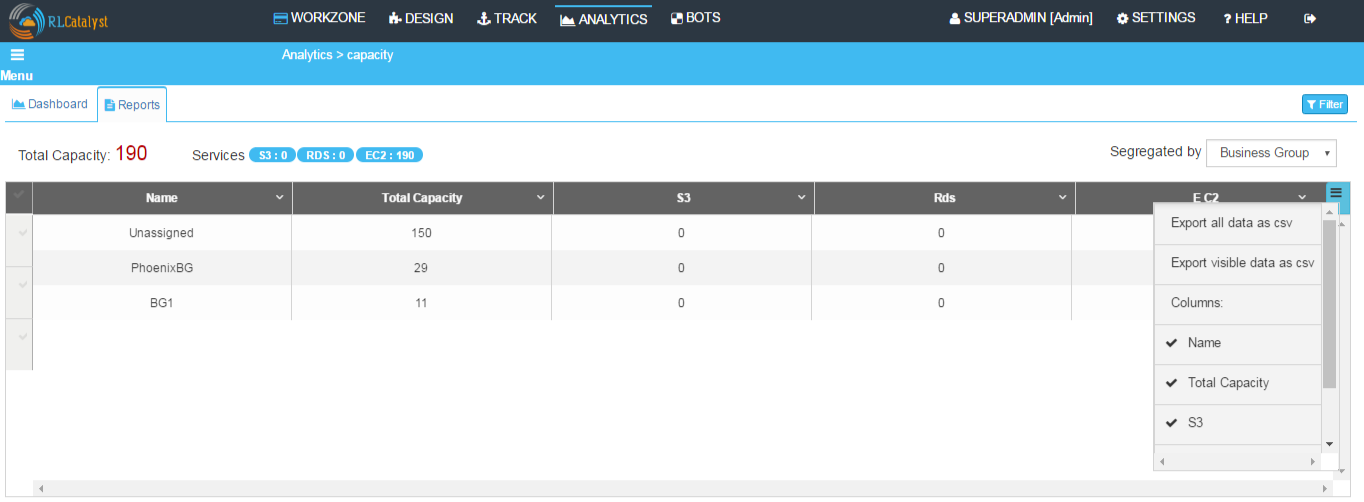
We have few options available for the table, on the right side of the table
We can remove any colunm from the table by just clicking on the field name, let say remove “Total Capacity”
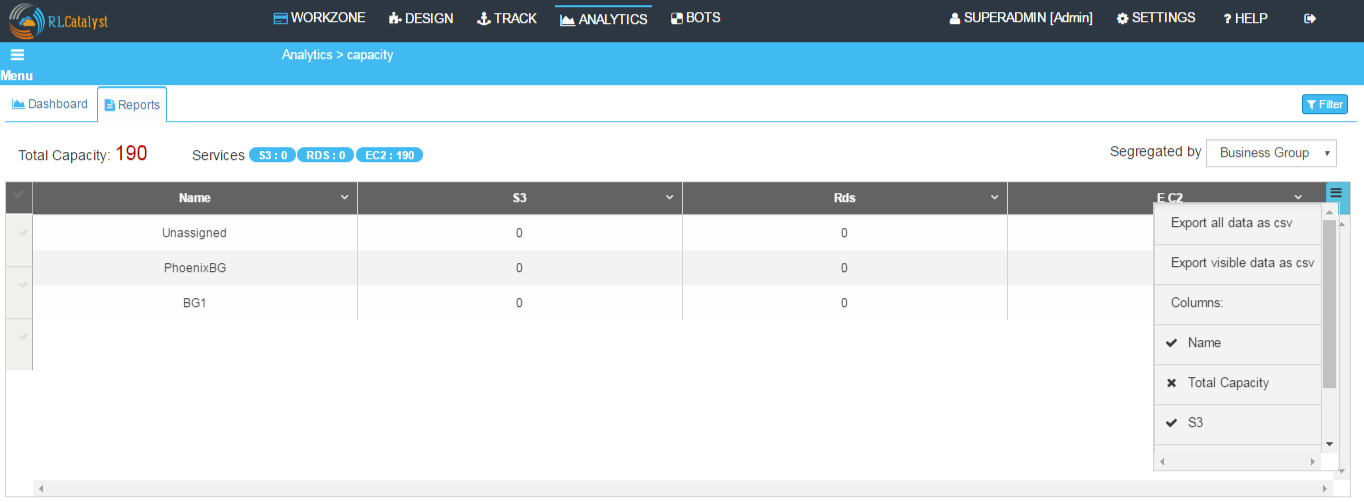
Now, “Total Capacity” field is not available in the table.
We have two more options “Export all data as cvs”, it will export all data from the table in cvs format. And “Export visible data as cvs”, it will save only the visible data from the table, it will not save the removed data from the table.
- Filter: We can filter the data on the basis of Organization and Provider.
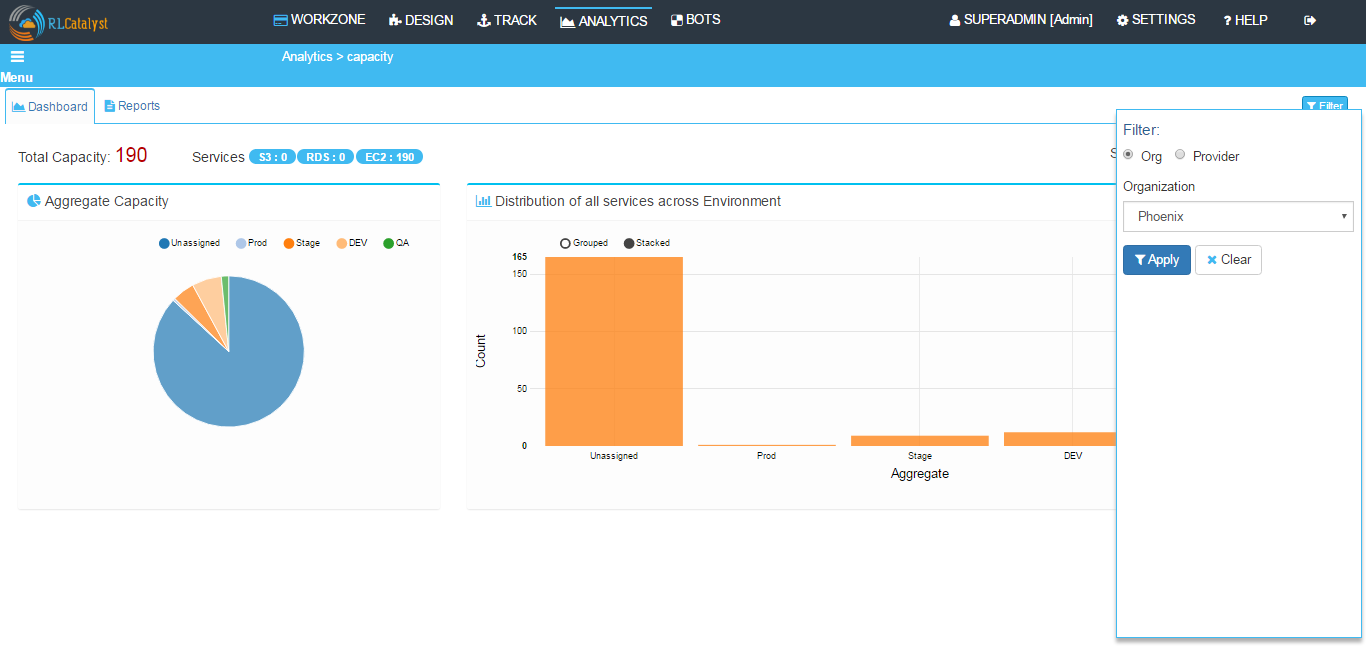
If we want to filter the data on the basis of provider, we can select any provider from the drop down
Usage
Usage is machine level usage matric.
Page has two tabs Dashboard and Reports.
- Dashboard:
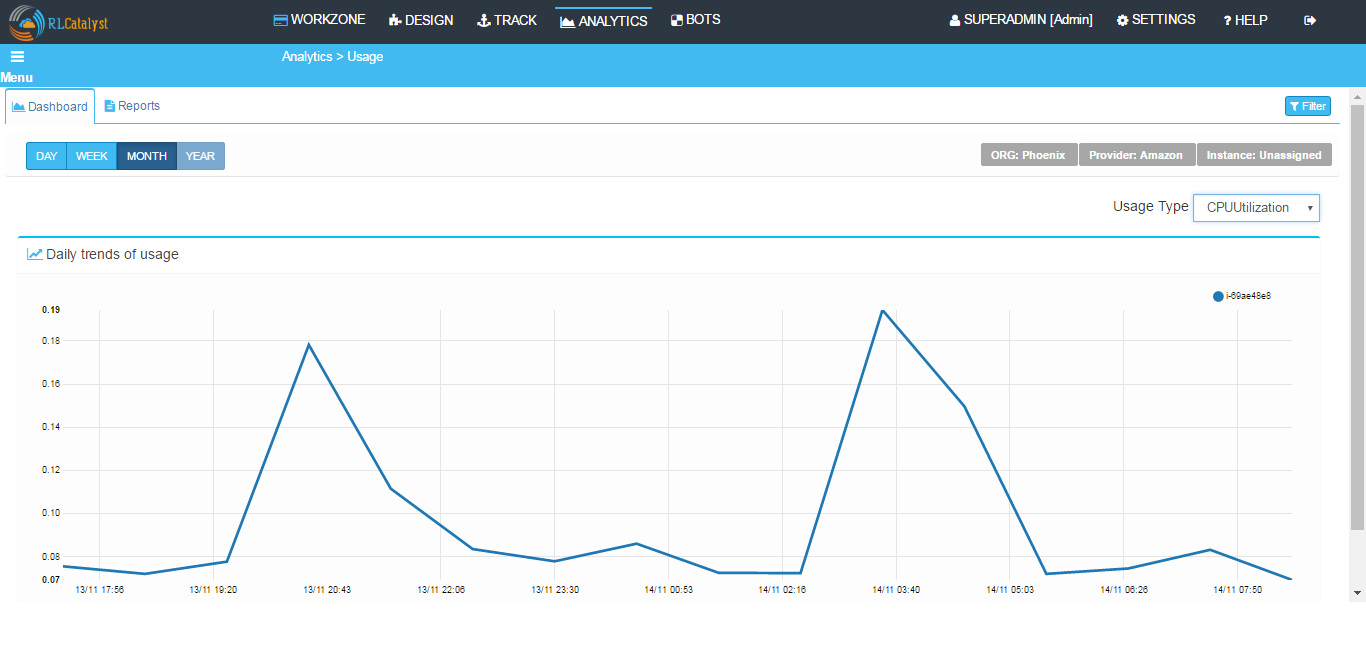
We have 5 Usage Type:
CPUUtilization: The percentage of allocated EC2 compute units that are currently in use on the instance. This metric identifies the processing power required to run an application upon a selected instance.
DiskReadBytes: This metric is used to determine the volume of the data the application reads from the hard disk of the instance. This can be used to determine the speed of the application.
DiskWriteBytes: This metric is used to determine the volume of the data the application writes onto the hard disk of the instance. This can be used to determine the speed of the application.
NetworkIn: The number of bytes received on all network interfaces by the instance. This metric identifies the volume of incoming network traffic to an application on a single instance.
NetworkOut: The number of bytes sent out on all network interfaces by the instance. This metric identifies the volume of outgoing network traffic to an application on a single instance.
Reports: In Reports tab the data will be in tabular form
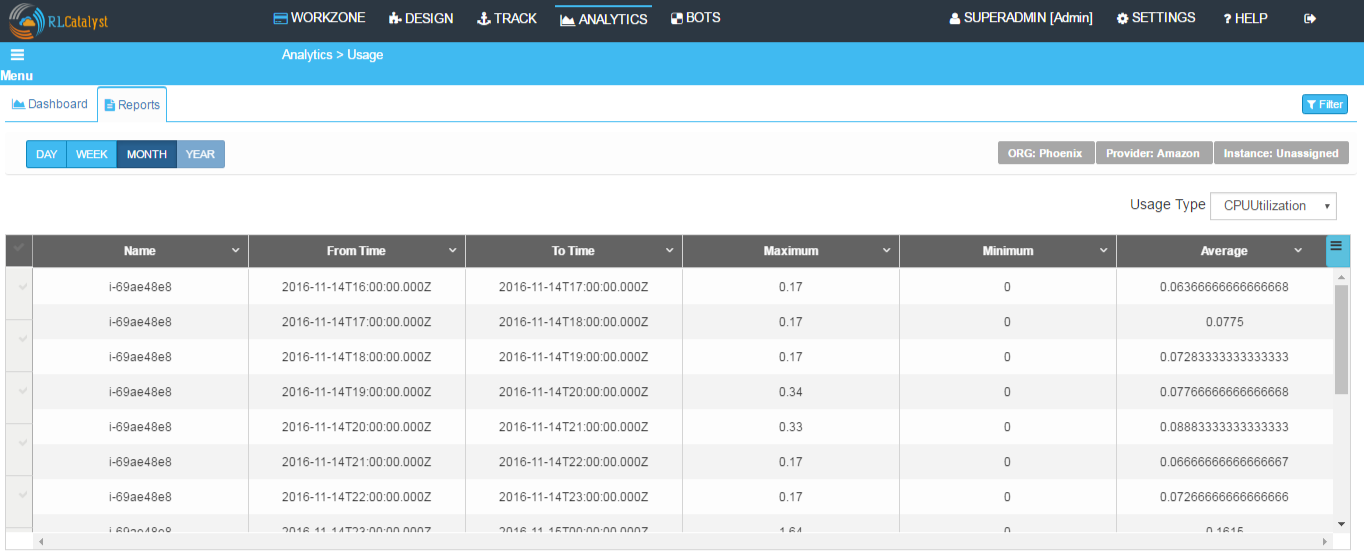
We have few options available for the table, on the right side of the table
We can remove any colunm from the table by just clicking on the field name, let say remove “From Time”
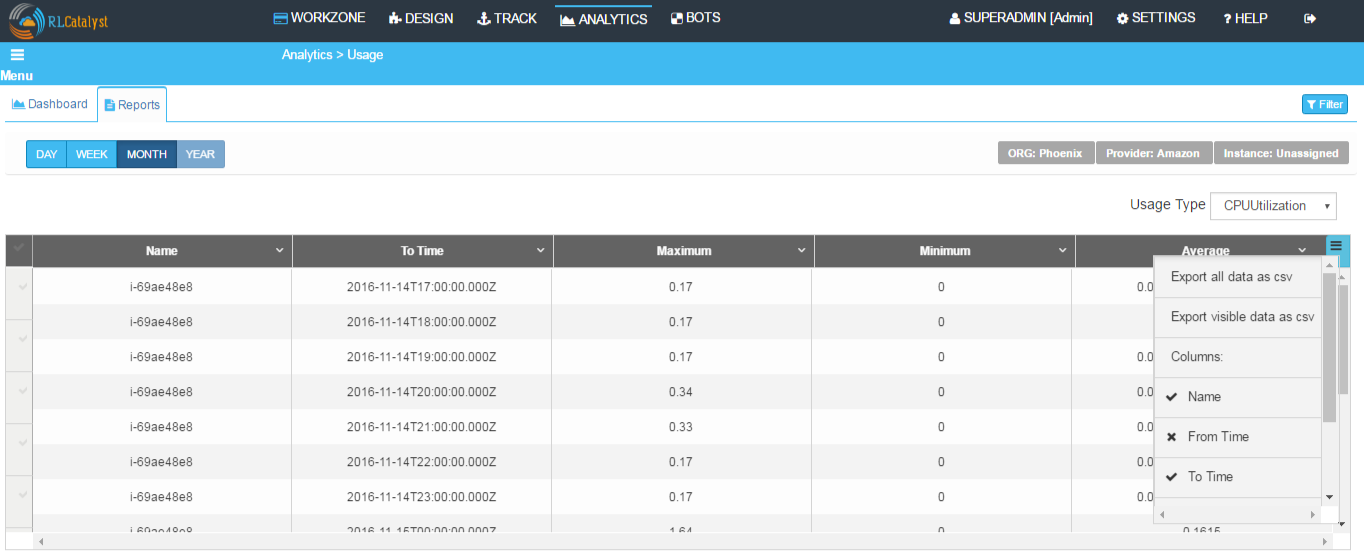
Now, “From Time” field is not available in the table.
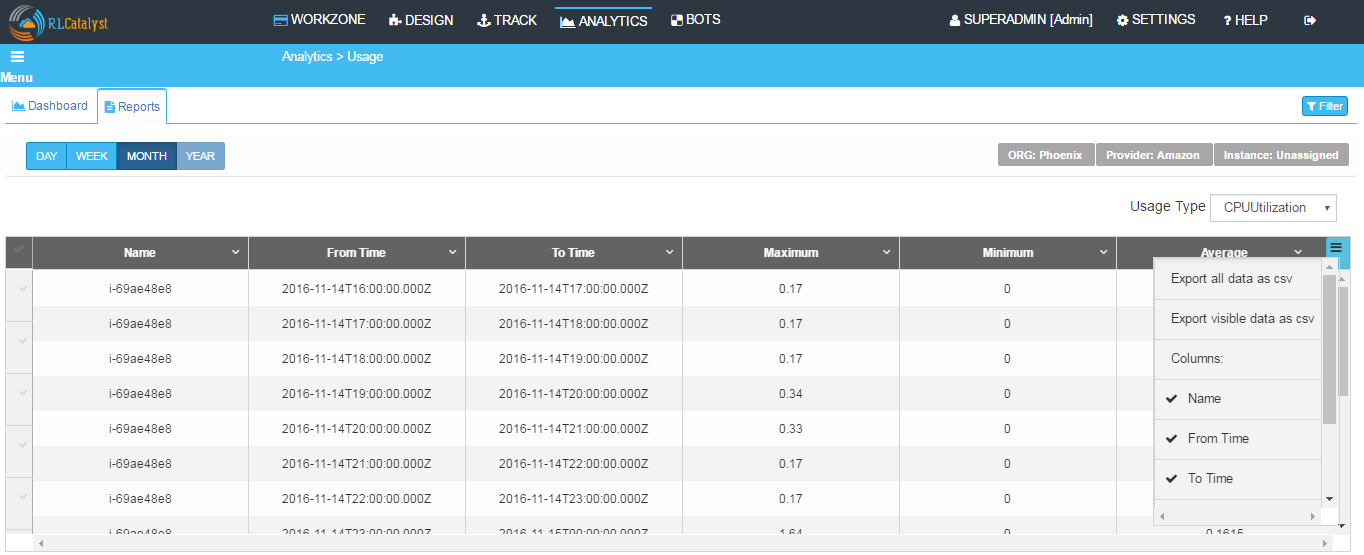
We have two more options “Export all data as cvs”, it will export all data from the table in cvs format. And “Export visible data as cvs”, it will save only the visible data from the table, it will not save the removed data from the table.
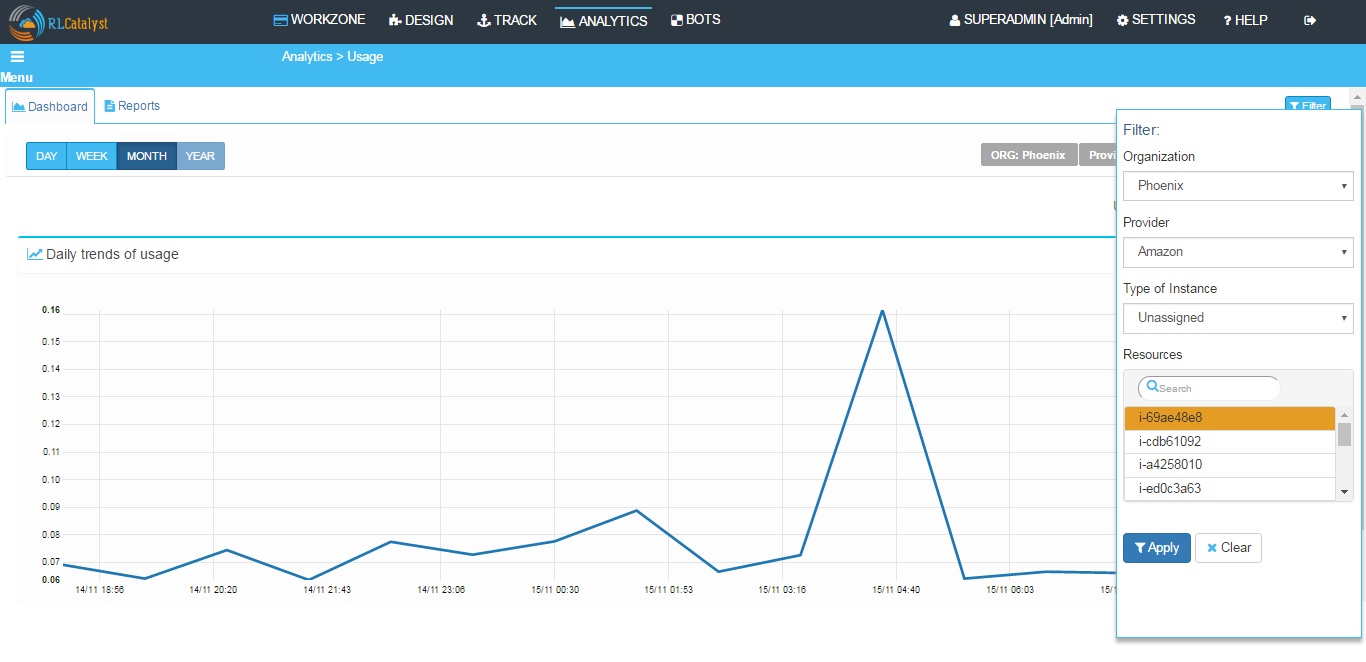
filter: We can filter the data on
- Organization: We can select any organization from the drop down
- Provider: Select any provider from available list of providers
- Type of Instance: Types of instances are Managed, Assigned and Unassigned. We can select any type of instance from the drop down
- Resources: Here we can search for some node and Apply for the filter