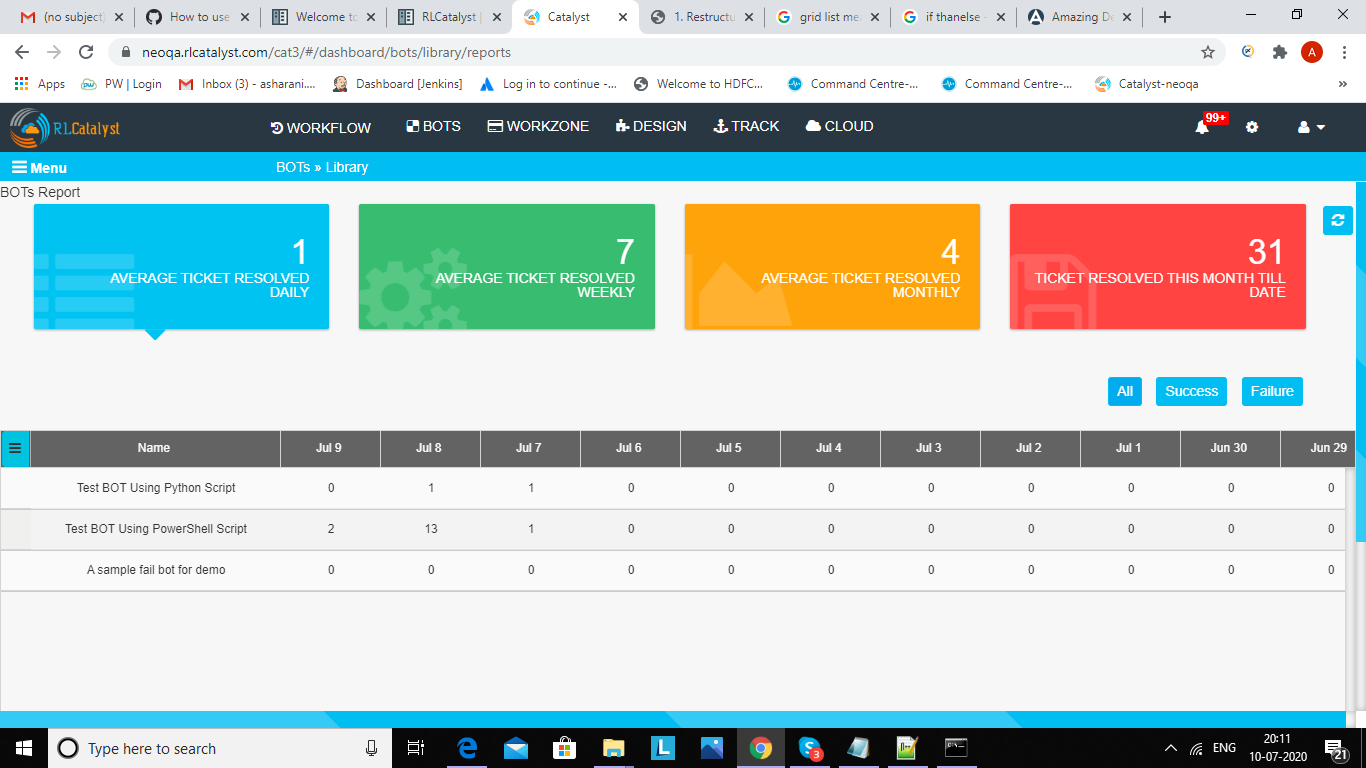
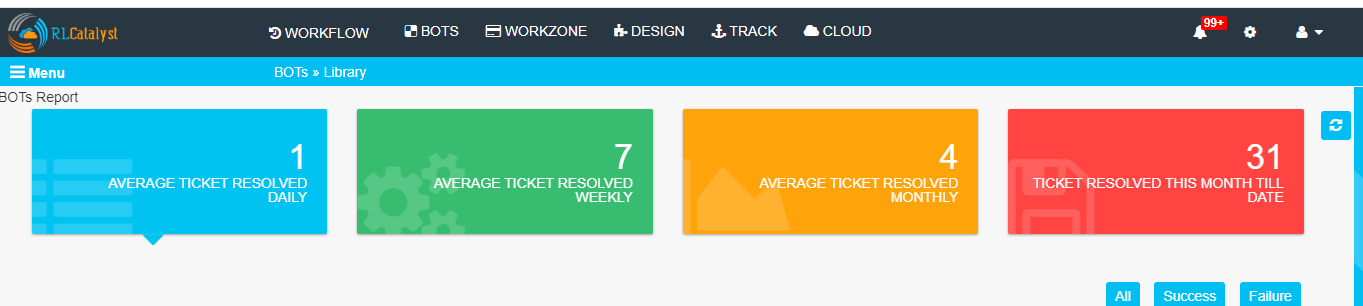
BOTs Report
We can see the average BOTs resolved ticket count at the top of the page for this day, this week and this month.
We can see average ticket resolved daily count with blue color card
We can see the average ticket resolved weekly count in green color card.When you click on the card it will display week-wise counts of the BOTs executed.
We can see average ticket resolved monthly count in yellow color card.When you click on the card it will display last 11 months counts of the BOTs executed.
We can see tickets resolved this month till date count in red color card.
When we click on All tab it will show the detailed list of BOTs executed in the last 30 days.

When we click on Success tab it will show the detailed list of BOTs executed successfully in the last 30 days.

When we click on Failure tab it will show the detailed list of BOTs executed with failed in the last 30 days.